-
AWTA Analytics
-
Key Test Data
-
Volume Trends
-
Declaration Rates
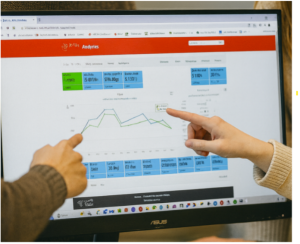
AWTA Analytics
This free interactive service provides access to current and historic testing data, including volumes, average measurements and trends.
The AWTA Analytics service features:
- Bales, Lots and Volume tested by month and progressive (season to date) back to 2001/02..
- Average test results with comparisons for equivalent period last season.
- Data can be narrowed down into various categories and States.
- Data can be refined to show various categories and States.
- Regionalised data is aggregated according to where the wool was grown (ie. by Wool Statistical Area)
- Data is displayed in graphs or tables.
- Can be viewed on any device including tablets and mobile phones.
- Reports can be downloaded as PDF or CSV files.
- Display can be translated into Chinese
This service is provided free of charge subject to users accepting our terms and conditions of use.
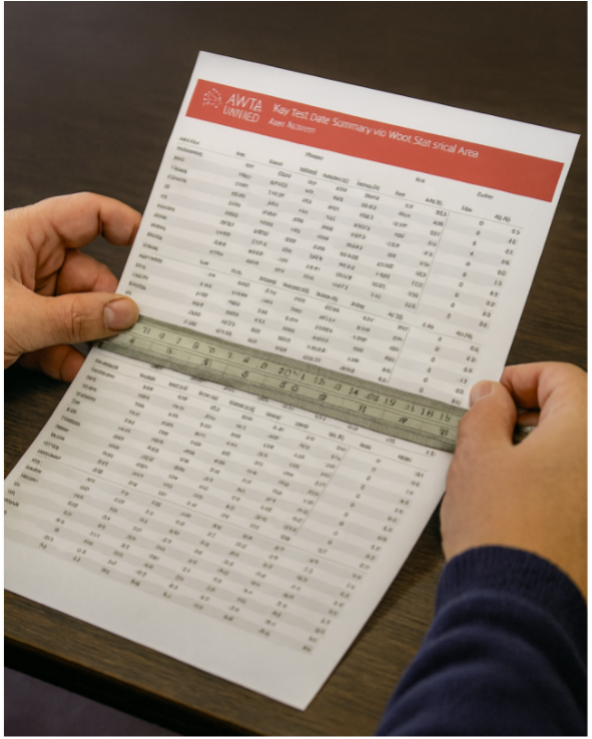
AWTA Key Test Data
AWTAs Key Test Data reports are updated monthly. These contain detailed information relating to the number of bales and lots tested by AWTA both for the current and previous seasons. There is also data detailing the comparative changes in Lots, Bales and Weight tested and seasonal changes in average Yield, Vegetable Matter, Fibre Diameter, Staple Length/Strength and Colour results. Further data relating to volumes measured within general Fibre Diameter ranges, plus Superfine and Ultrafine wool trends is included.
Live statistical data is available on the AWTA Analytics page. This facility includes current and historical information that can be generated in various formats for download.
Key Test Data
-
Monthly Reports
-
Seasonal Reports
Monthly Reports
-
PDF
-
RTF
Seasonal Reports
-
PDF
-
RTF
Volume & Trends
AWTA’s centralised certificate database contains data for the number of bales tested, the weight of wool tested and associated objective measurements since 1991/92.
As almost every lot of wool sold in Australia is certified for Yield and Fibre Diameter before sale, this data correlates closely to the overall production of wool in Australia. Representing this data by Wool Statistical Area provides a regionalised view of the national wool clip. Indeed, it forms a key component of the information used by the national Wool Production Forecasting Committee to predict year-on-year wool production volumes and trends.
-
WSA
-
WPFC
Wool Production by Statistical Area
The Australian Wool Testing Authority (AWTA) testing database holds detailed information about the origin of wool samples, including both the location where the sample was taken and the region where the wool was grown. Sample locations are recorded by AWTA Sampling Officers during the certification of sale lots. In contrast, the region of wool production—referred to as the Wool Statistical Area (WSA)—is provided by the broker or seller. The image below presents the year-on-year change in wool production by WSA since 2000.
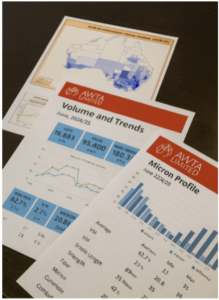
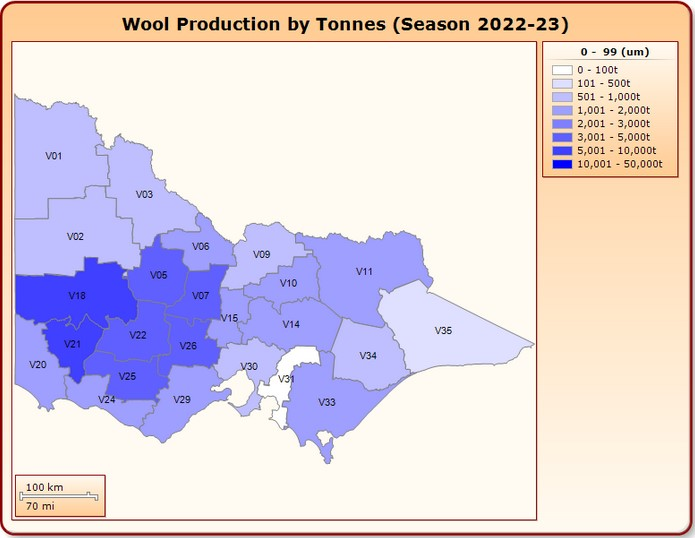
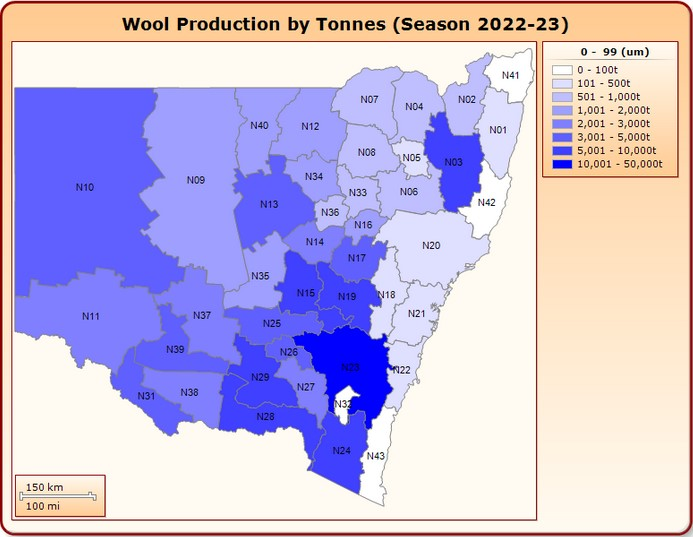
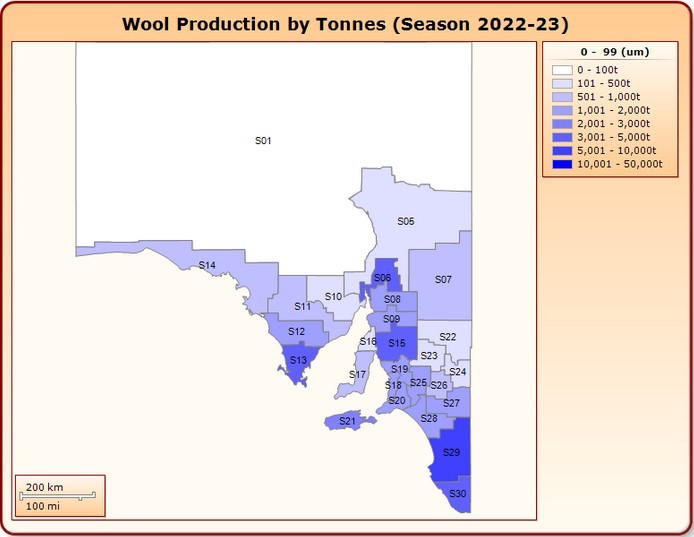
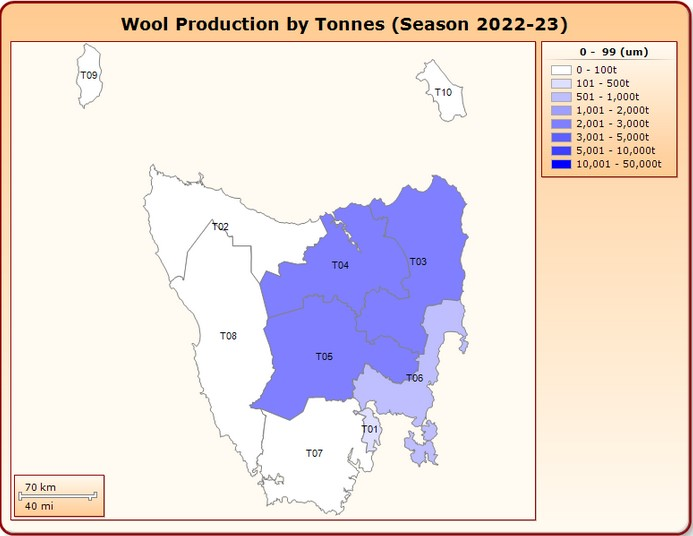
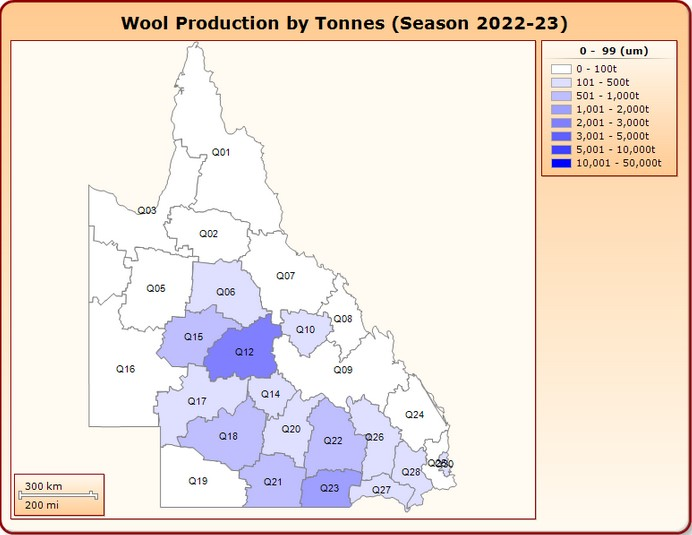
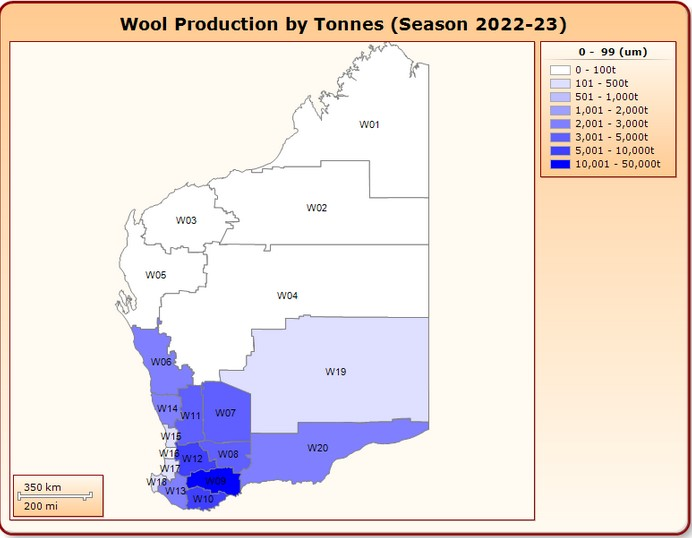
WSA Production Maps
Displayed below are maps showing the tested wool production within each state by WSA for the last season. Colour graduations are used to show the relative changes in wool production in each area; the darker the colour the greater the amount of wool.
AWTA Wool Statistical Area Report – National
Year-on-Year Comparison
by State & WSA
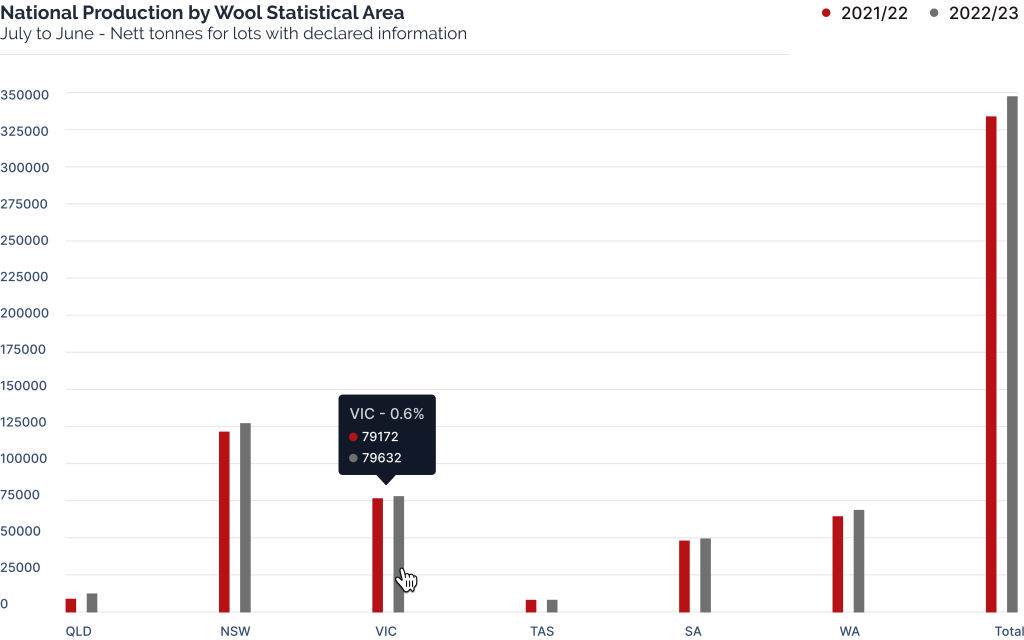
The following charts show the volume of wool tested from each State for the current and previous selling seasons across each Wool Statistical Area (WSA) and the % change from season to season.
AWTA Wool Statistical Area Report – National
Fibre Diameter
Mean Fibre diameter (Micron) is the single most important measurement used to determine the value of raw wool. The measurement is expressed in micrometres (microns) and refers to the average diameter of fibres in a sale lot. In general terms, the finer the wool the more it is worth. This relationship has led to a lowering of the average fibre diameter over recent seasons, with the proportion of fine wool (ie. <19.5 microns) increasing as a total percentage of the wool produced each year.
AWTA’s testing database contains extensive data on the range and distribution of fibre diameter measurements conducted on the Australian Wool clip since 1991/92. The seasonal changes in the micron profile and related production trends are provided for download below.
Trends in Mean Fibre Diameter
Download the full Micron Trends report: Trends within Micron Range
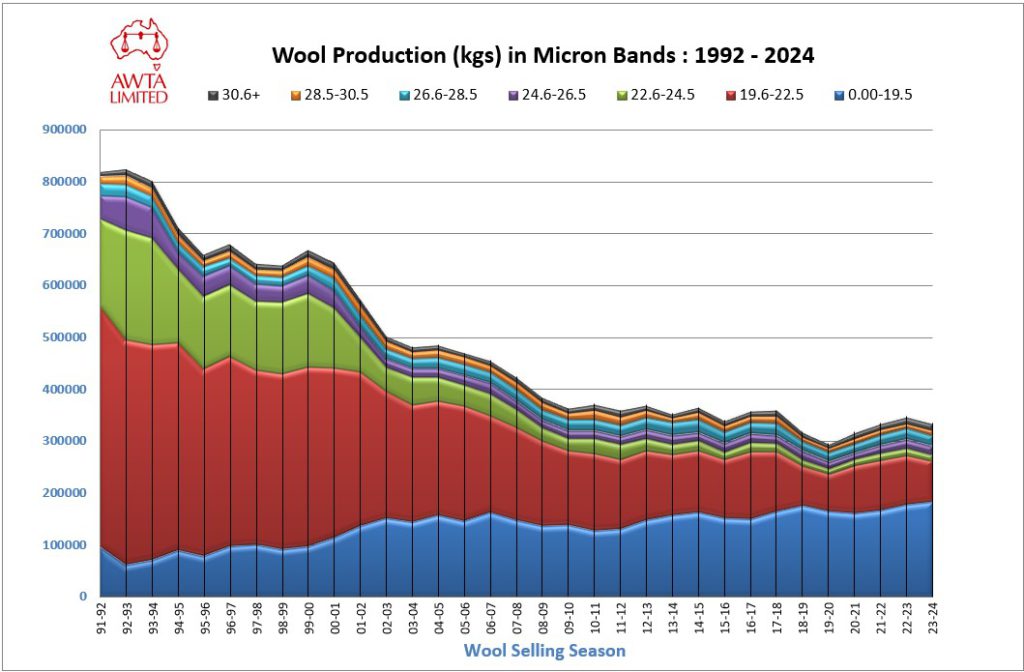
Micron Profiles
The animated GIF below illustrates the progressive changes to the micron profile of the Australian Wool clip since 1992/93.
The most noticeable change is the significant increase in the proportion of fine wool (<19.5µ) and crossbred wools (26-30µ) since 2000/01 which is reflected by the bi-modal distribution.
Download the full Micron Profile Report: AWTA Historical Micron Profiles
The Finest Certified Tests Measured by AWTA
Australia is renowned for producing the world’s best merino apparel wool. Premiums exist for bales of wool with the lowest fibre diameter or ‘finest Micron’. There is competition among specialist producers of fine wool to hold or break the record for the finest bale.
The table below is a historical list of the finest sale lots tested and certified by AWTA Ltd. Whilst there may be others that have achieved the same mean fibre diameter (MFD), the lots listed here were the first to be measured at the respective micron values.
| Tested | Laboratory | Brand | MFDµ | Method |
| Nov-23 | Melbourne | ROWENSVILLE | 10.9 | L |
| Jan-16 | Melbourne | PYRENEES PARK | 11.0 | L |
| Nov-11 | Melbourne | HIGHLANDER ULTRAFINE | 11.1 | L |
| Jun-11 | Melbourne | PYRENEES PARK | 11.2 | O |
| Dec-09 | Melbourne | HIGHLANDER ULTRAFINE | 11.4 | L |
| Nov-08 | Sydney | HIGHLANDER ULTRAFINE | 11.5 | L |
| May-05 | Sydney | HIGHLANDER ULTRAFINE | 11.6 | L |
| Mar-06 | Melbourne | KADINIA/BRIM | 11.7 | L |
| Nov-04 | Melbourne | WOOL FACTORY/HORSHAM | 11.8 | O |
| Feb-04 | Sydney | PRIMERINO | 11.9 | O |
| Feb-03 | Melbourne | NERRAWAK | 12.0 | O |
| Apr-02 | Sydney | HIGHLANDER ULTRFINE | 12.1 | O |
| Jan-02 | Melbourne | NERRAWAK | 12.5 | O |
| Apr-01 | Sydney | HIGHLANDER ULTRFINE | 12.9 | O |
| Mar-00 | Melbourne | KARROO | 13.2 | A |
| Mar-98 | Melbourne | WOOL FACTORY/HORSHAM | 13.3 | A |
| Nov-97 | Melbourne | WOOL FACTORY/HORSHAM | 13.4 | A |
| May-96 | Melbourne | WOOL FACTORY/HORSHAM | 13.5 | A |
| Mar-95 | Melbourne | KADINIA/BRIM | 13.7 | A |
| Dec-94 | Melbourne | KADINIA/BRIM # | 13.8 | A |
| Jan-93 | Melbourne | KADINIA/BRIM | 14.3 | A |
| Jan-92 | Melbourne | KADINIA/BRIM | 14.5 | A |
# Now known as the “Million Dollar Bale”Note: Methods are:
(L) Sirolan Lasercsan – introduced from July 2000
(O) Optical Fibre Diameter Analyser (OFDA)
(A) Airflow meter (replaced by Laserscan)
Wool Production Forecasting
The Australian Wool Production Forecasting Committee (AWPFC) draws together a range of objective data and qualitative information to produce consensus-based, authoritative forecasts of Australian wool production three times a year. AWTA has maintained a long-standing role in this process, through membership of the various commitees plus in the provision of statistical data and professional expertise.
The Committee has a three-level structure, with a national committee reposible for the determination of overall wool production estimates based on information and advice from state sub-committees. There is also a Technical Working Group that is reposnsible for maintaining the relevence and accuracy of all data used in the forecasting process.
The AWPFC is funded by Australian Wool Innovation Limited (AWI), which also provides the Chairman and adminsitrative support to the National committee.
The members use data from AWI, AWTA, ABARE, DPI and the state commitees to estimate wool production for the current season and forecast levels for the following season. These estimates are communicated to the industry via press release with an accompanying report published by AWI that details the data analysis and commentary on the key drivers.
The latest press releases and reports are downloadable direct from the AWPFC page:
https://www.wool.com/market-intelligence/wool-production-forecasts/
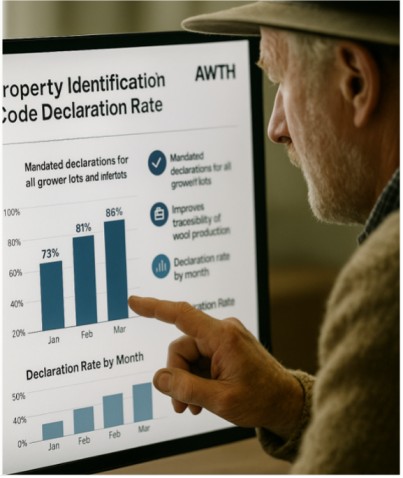
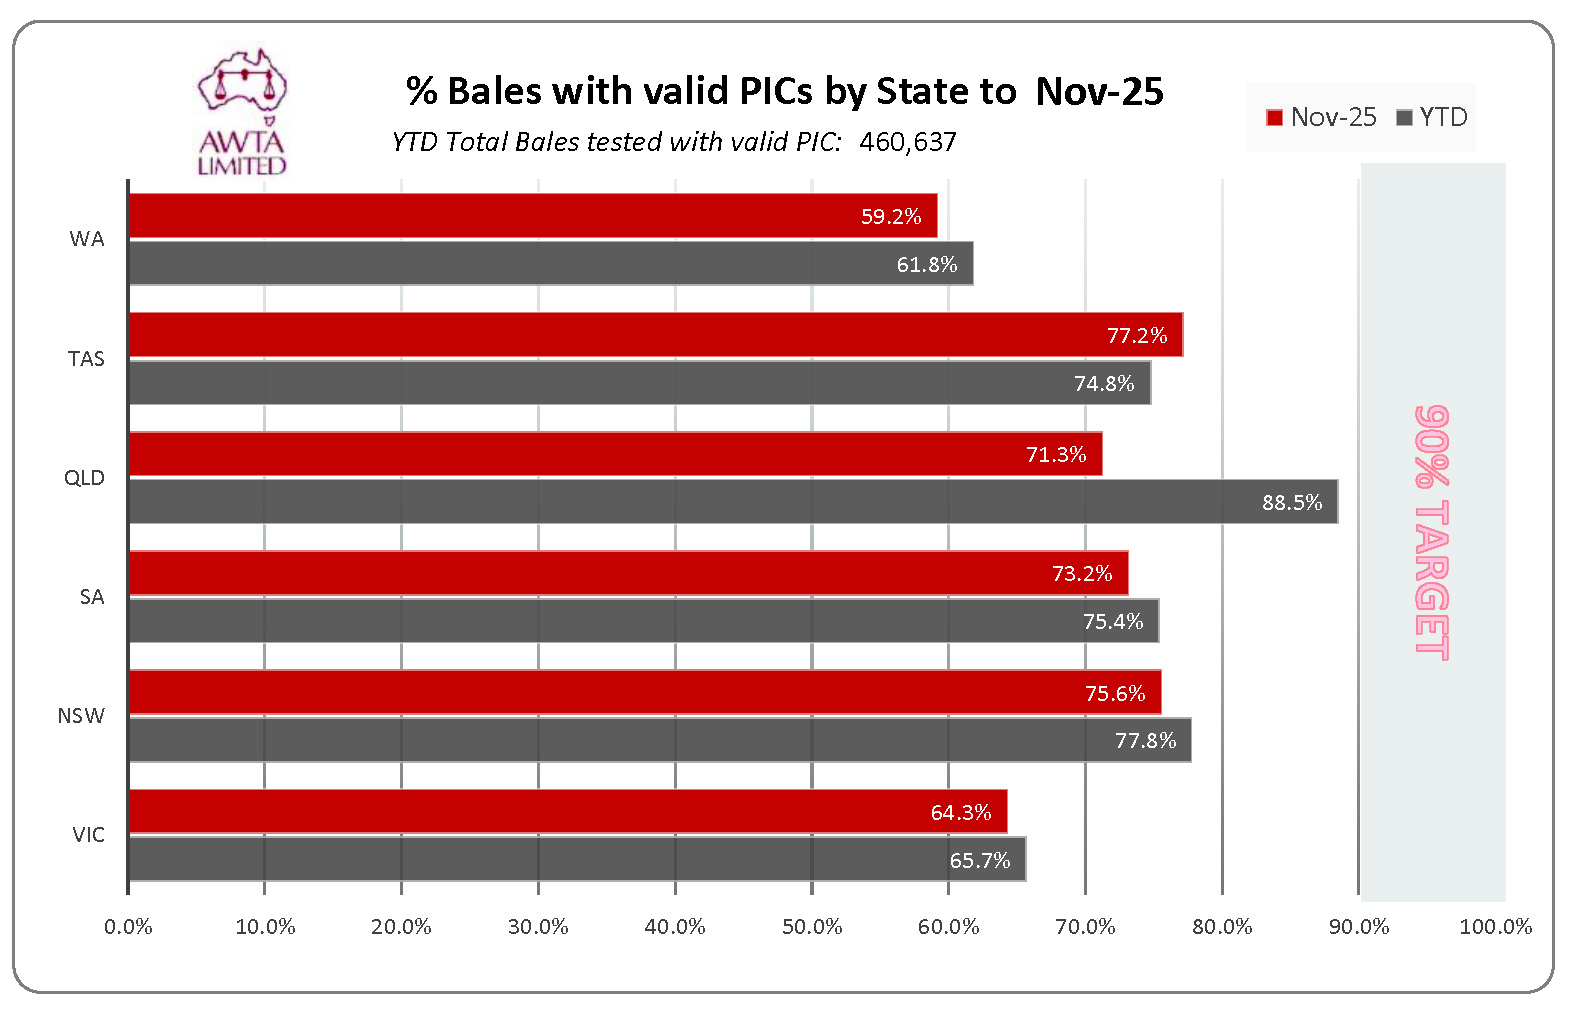
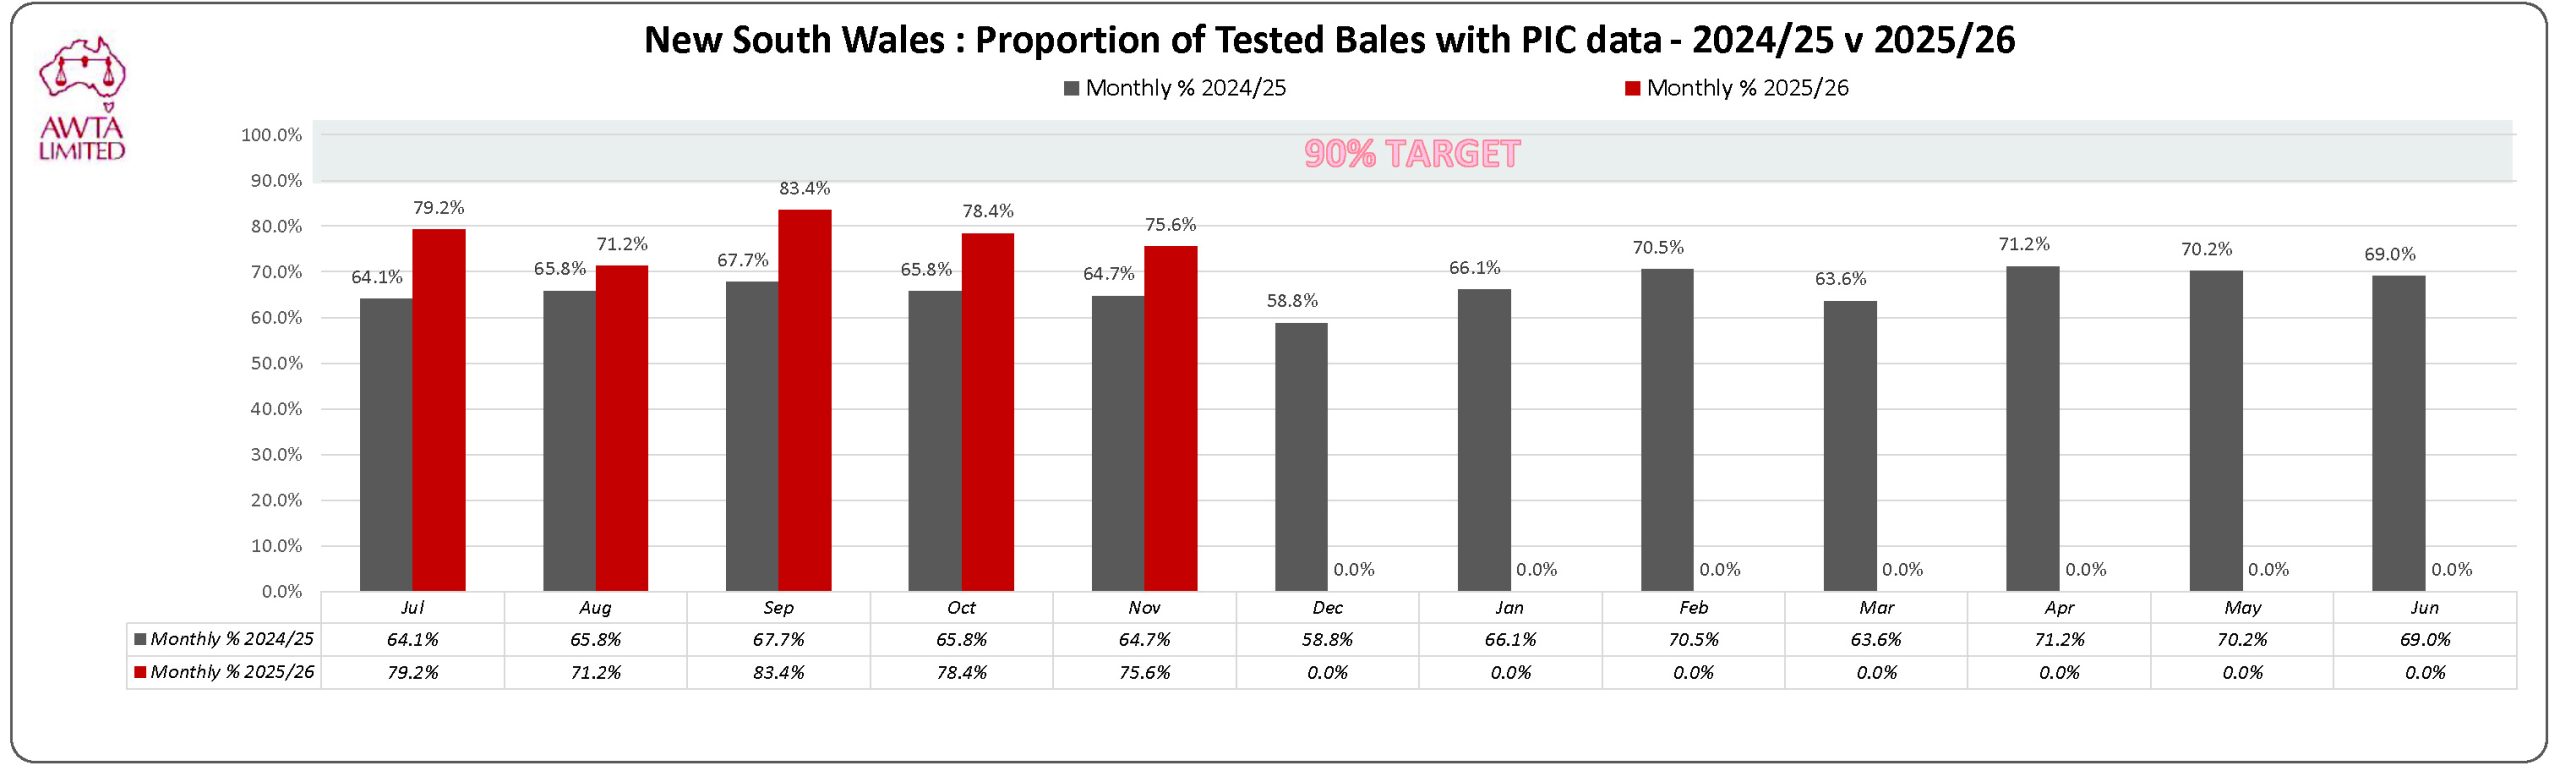
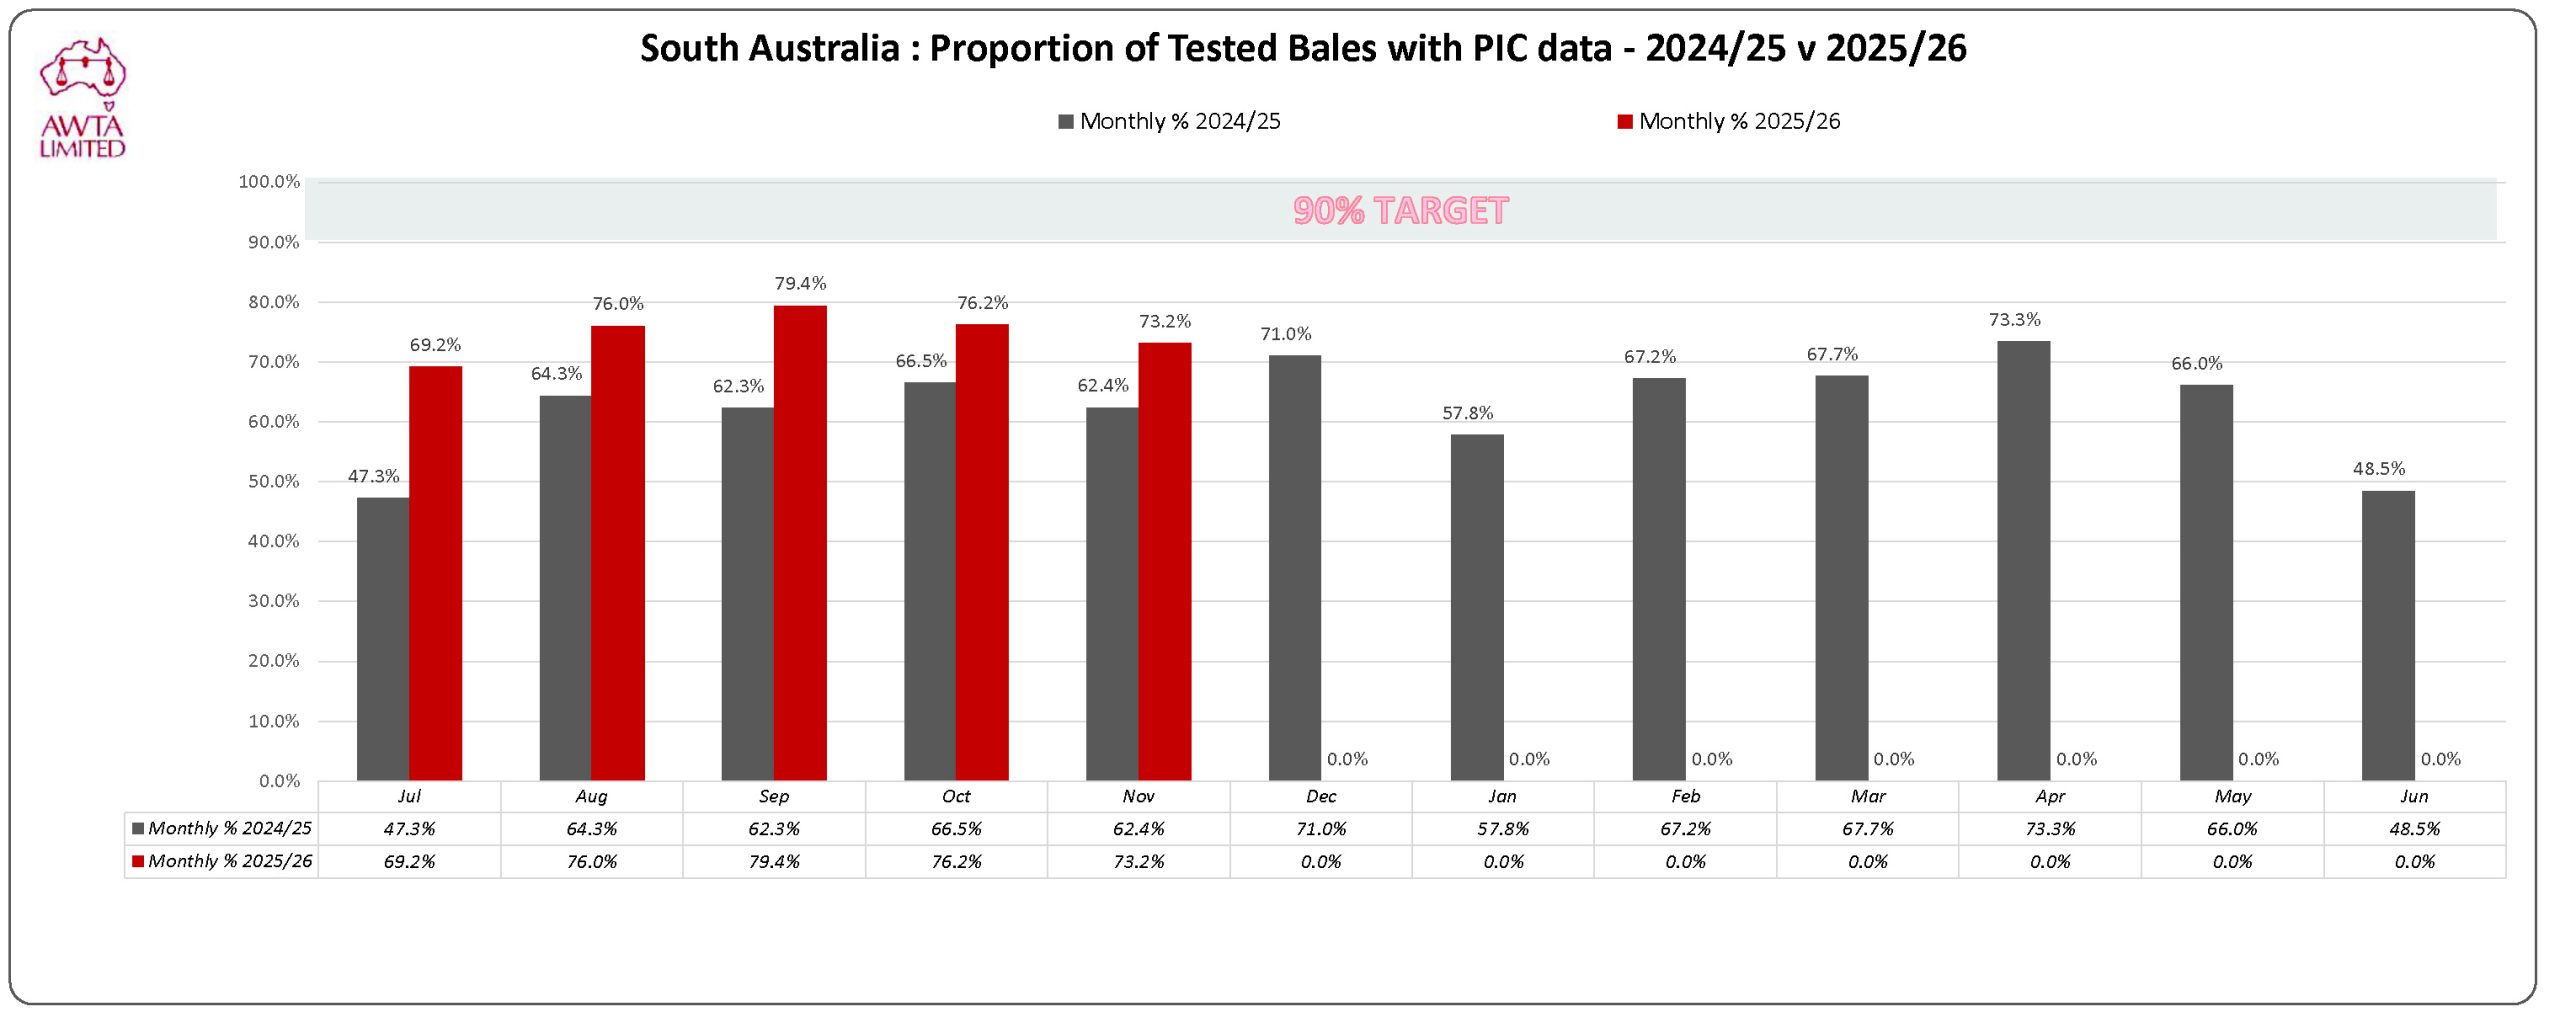
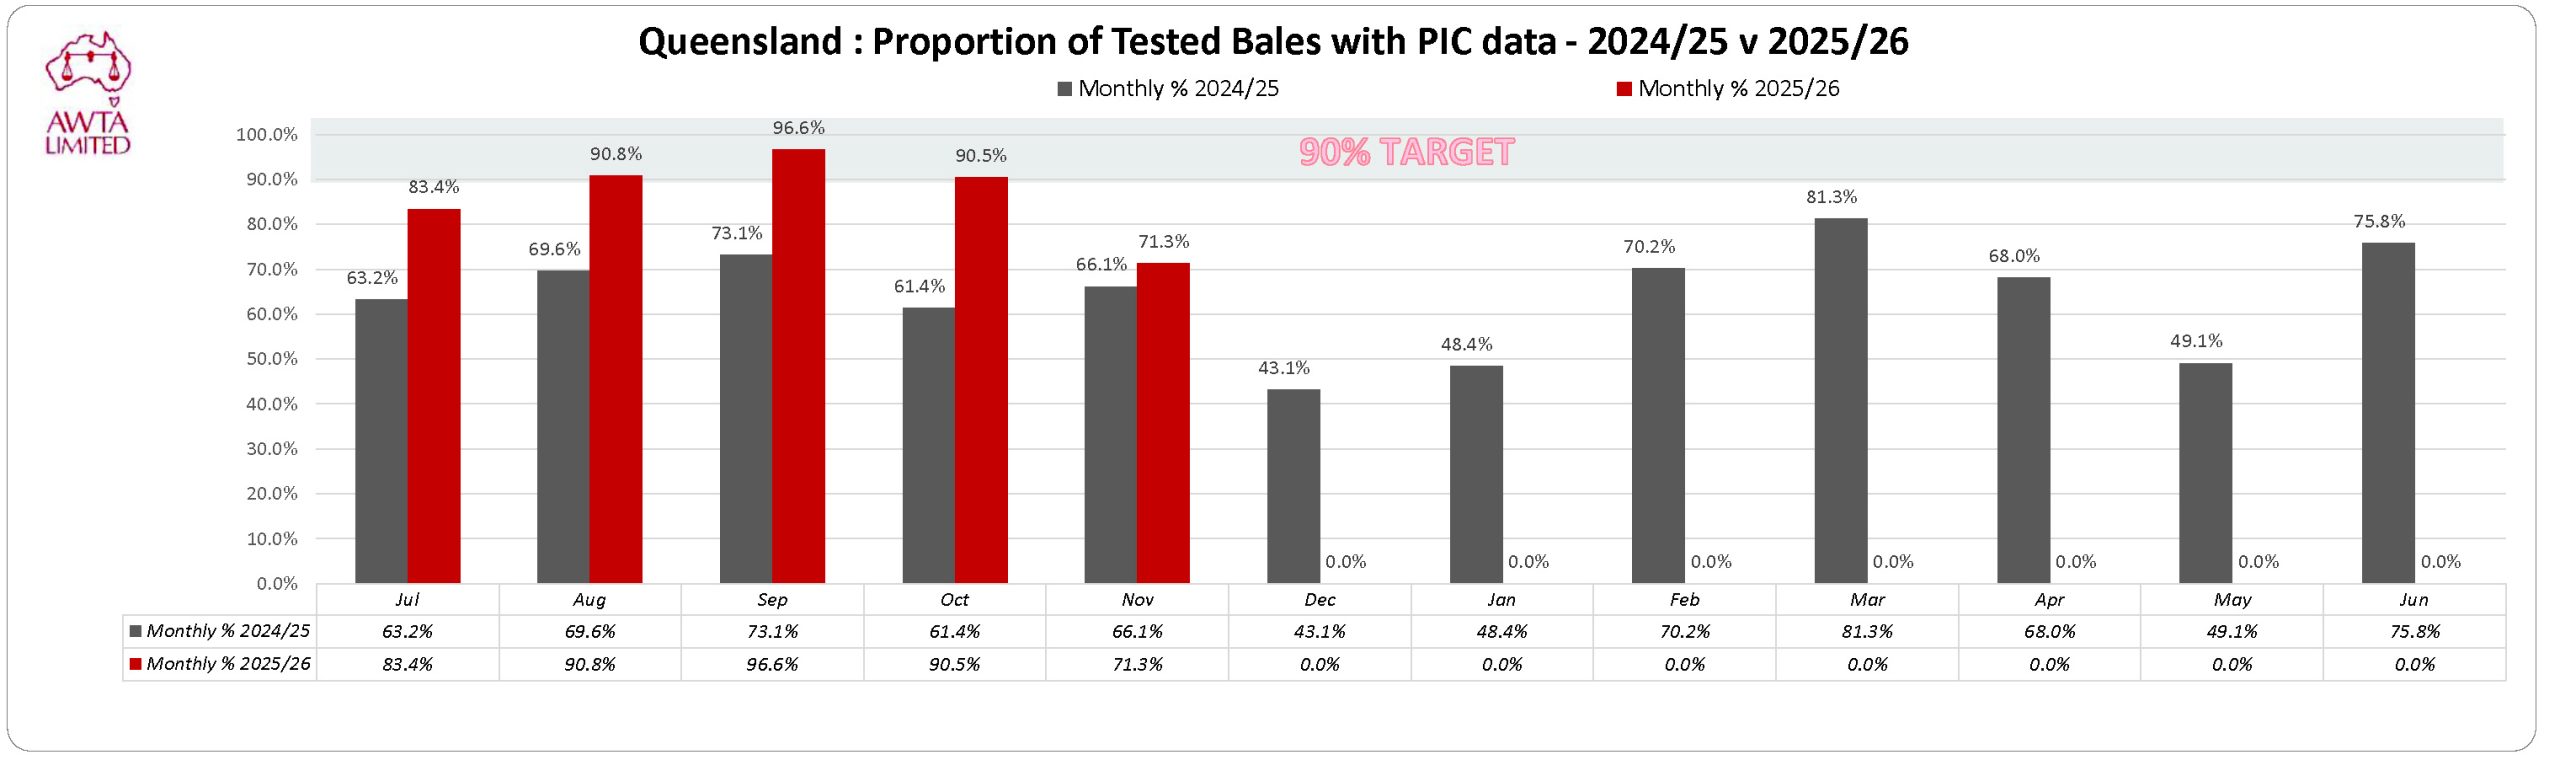
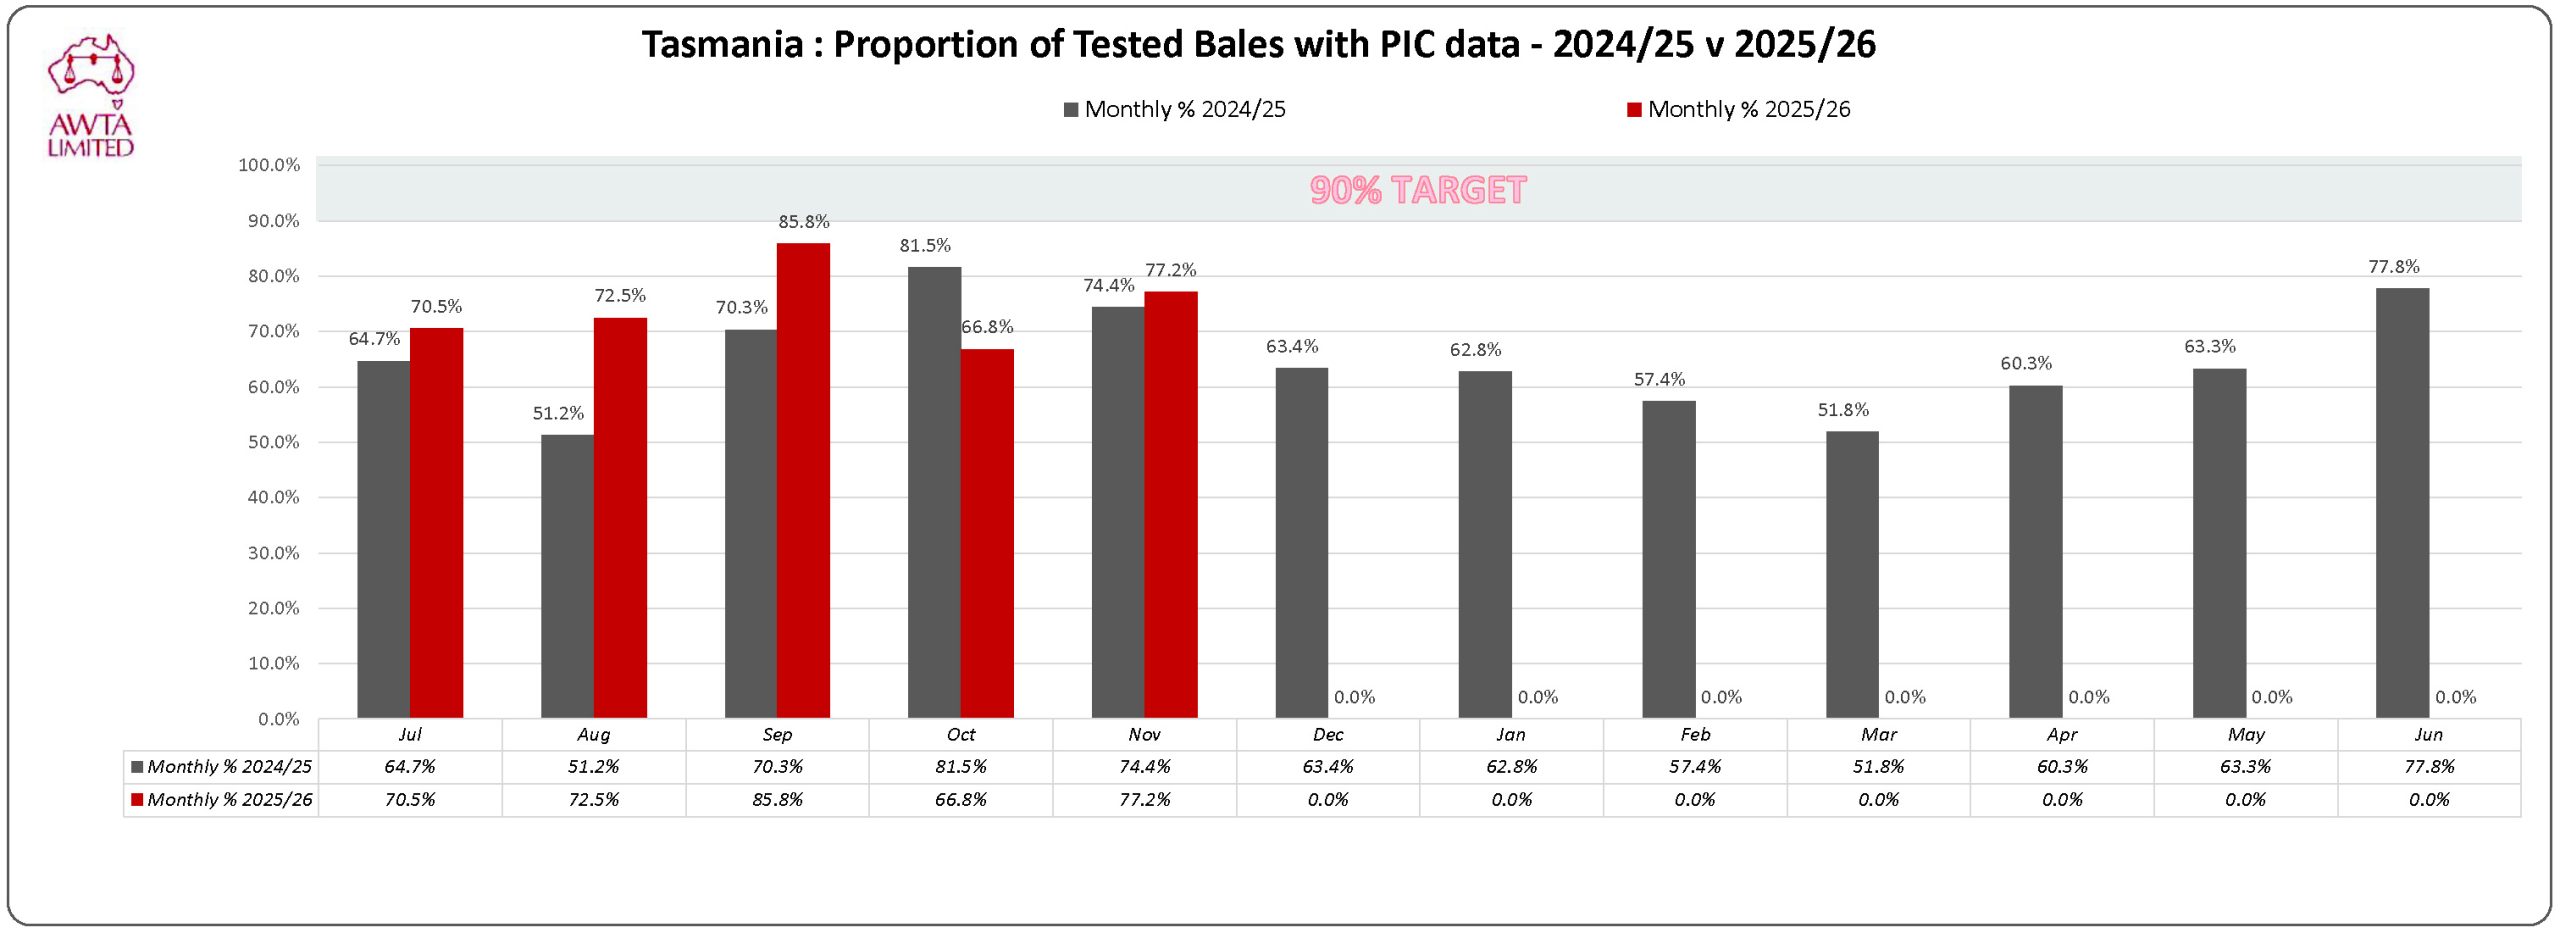
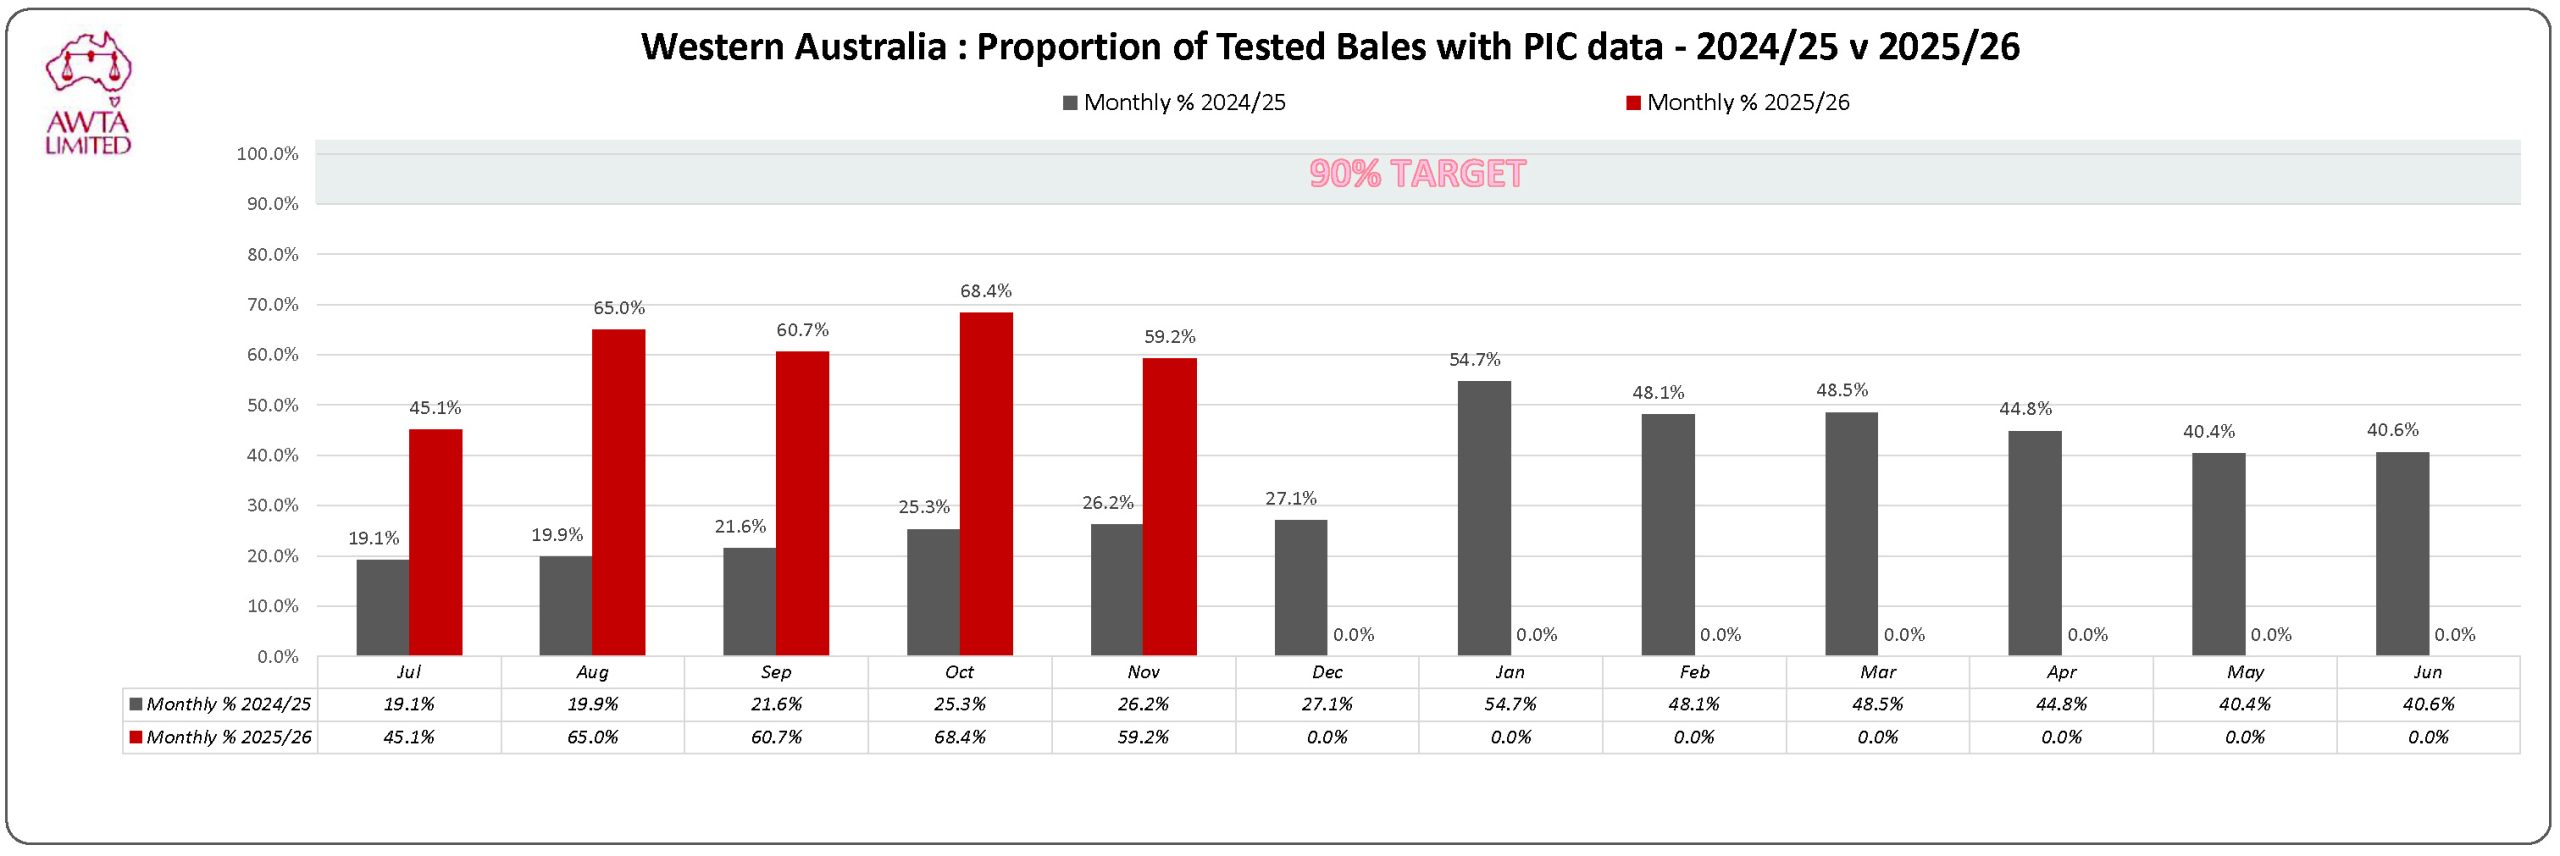
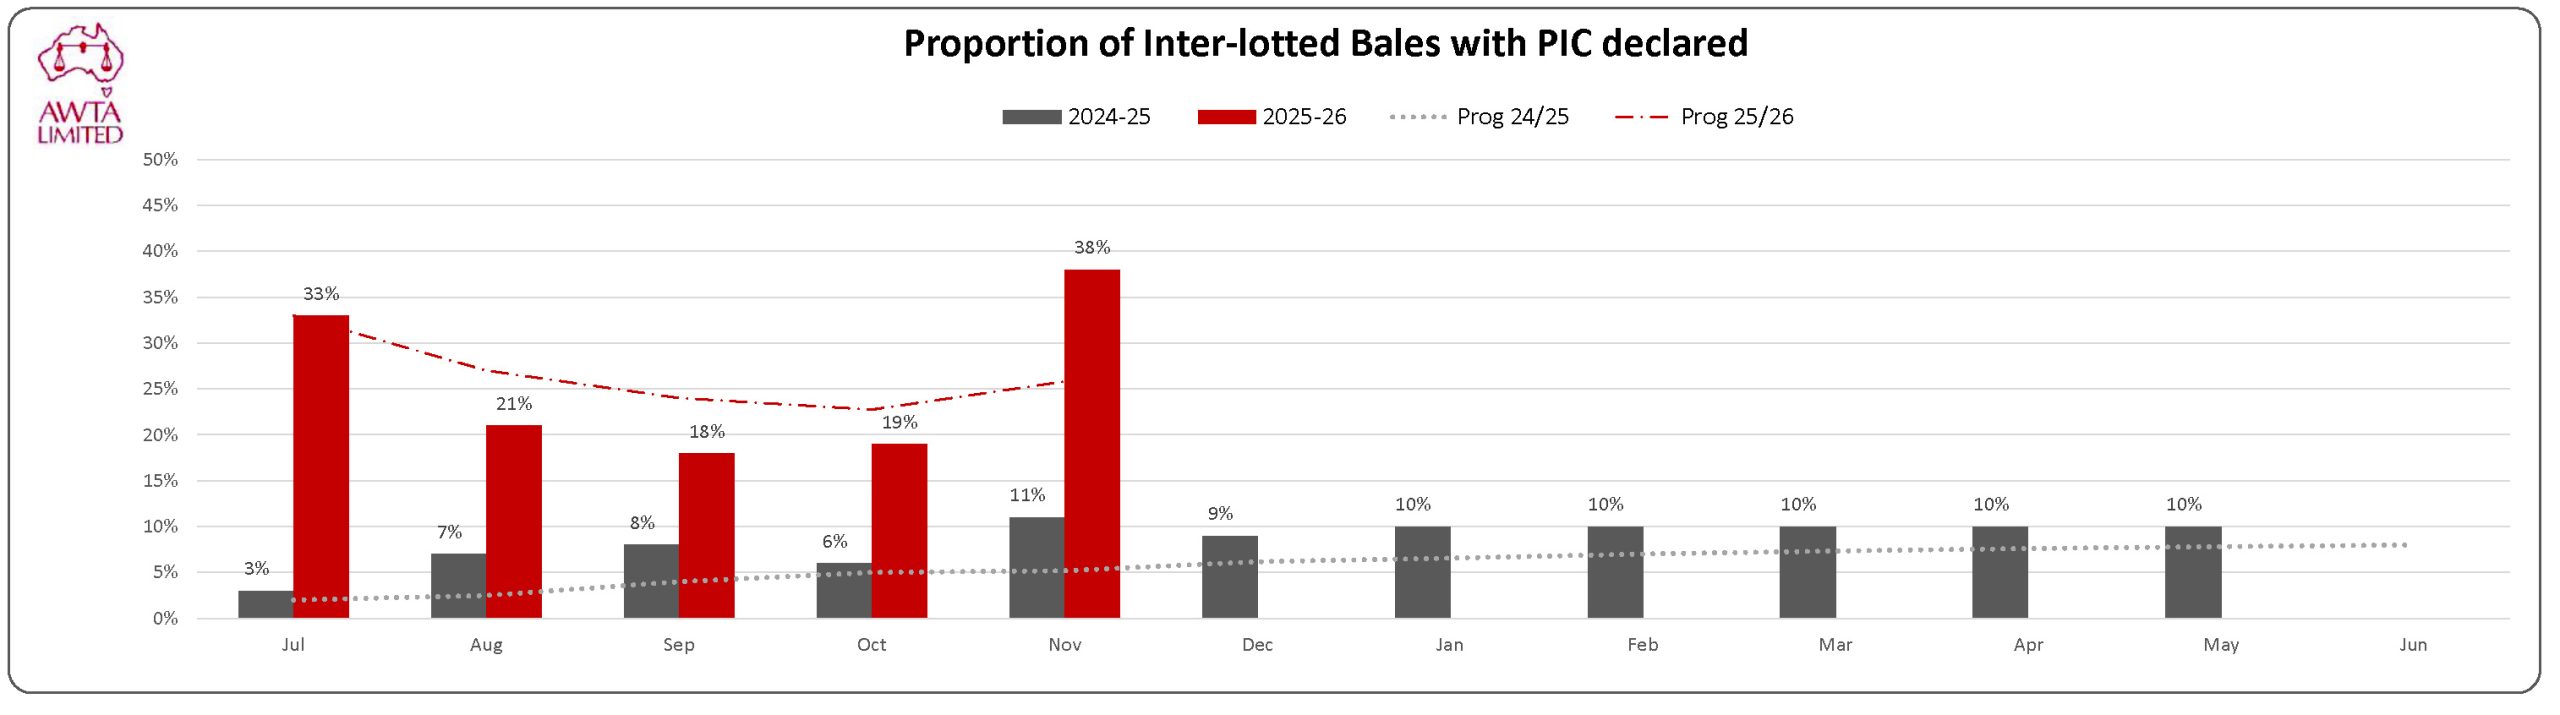
Property Identification Code (PIC) transmission rates:
AWTA retains Property Identification Codes (PICs) submitted by sellers during the presale testing process. Only the PIC itself is stored—without any associated grower or farm property information—ensuring that the data remains private and anonymous.
This dataset plays a vital role in mitigating the impact of an Emergency Animal Disease (EAD) outbreak by allowing authorities to quickly trace potentially affected wool between storage and dump sites. To ensure this capability is effective, a high rate of PIC declaration is essential. Industry groups, in collaboration with the Australian Wool Traceability Hub (AWTH)—now owned and managed by AWTA—are working to improve PIC uptake across the supply chain.
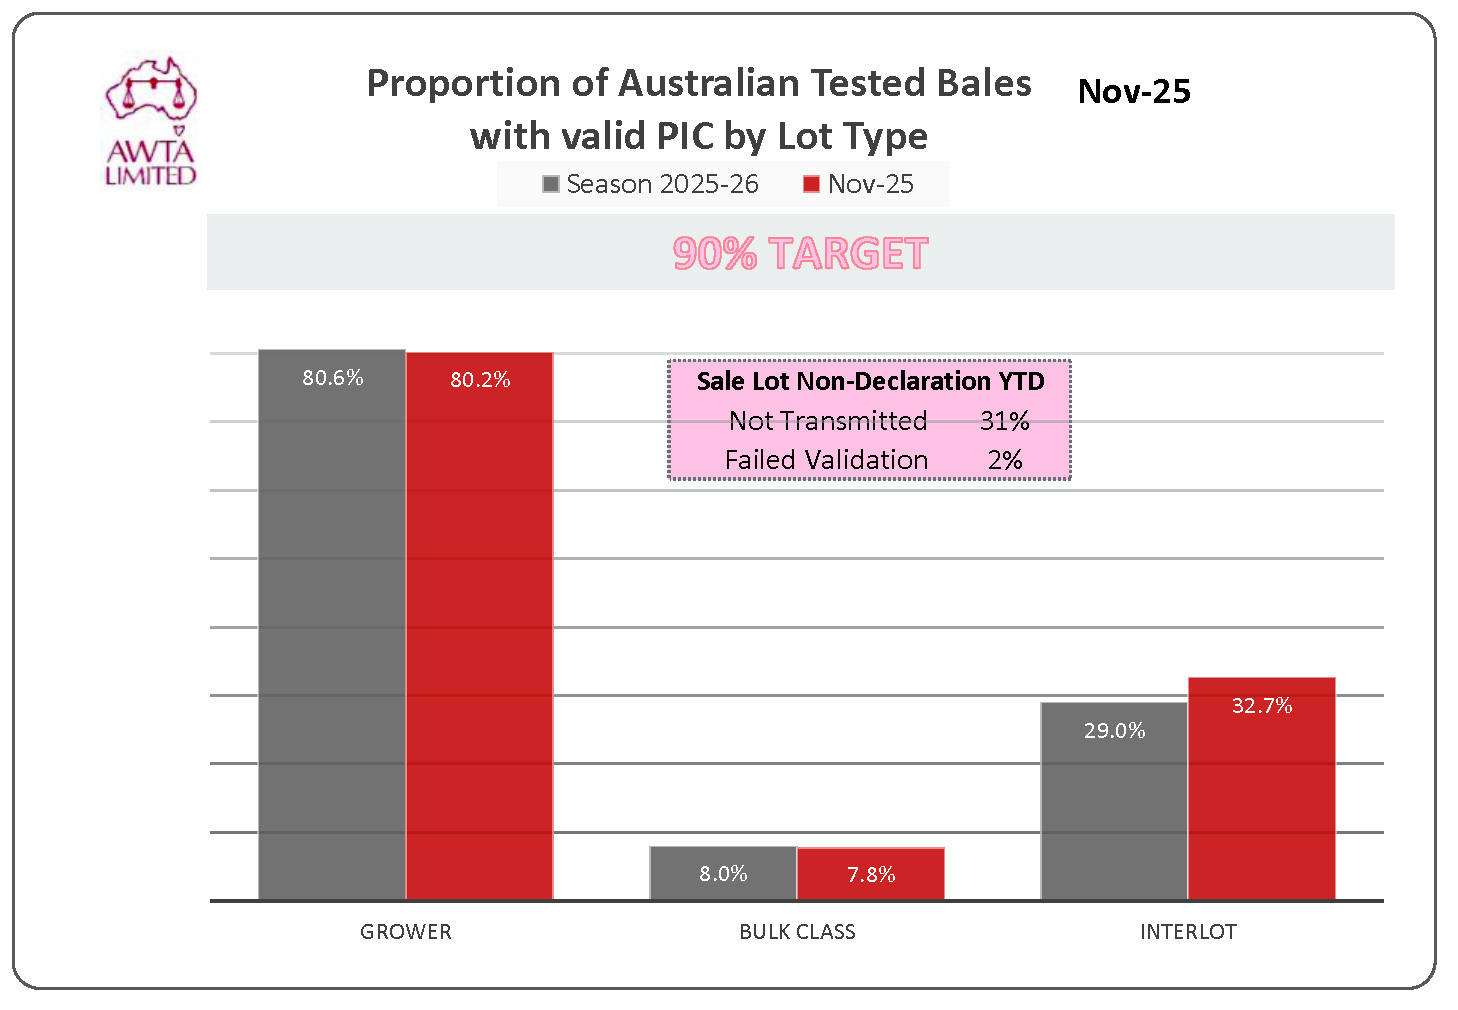
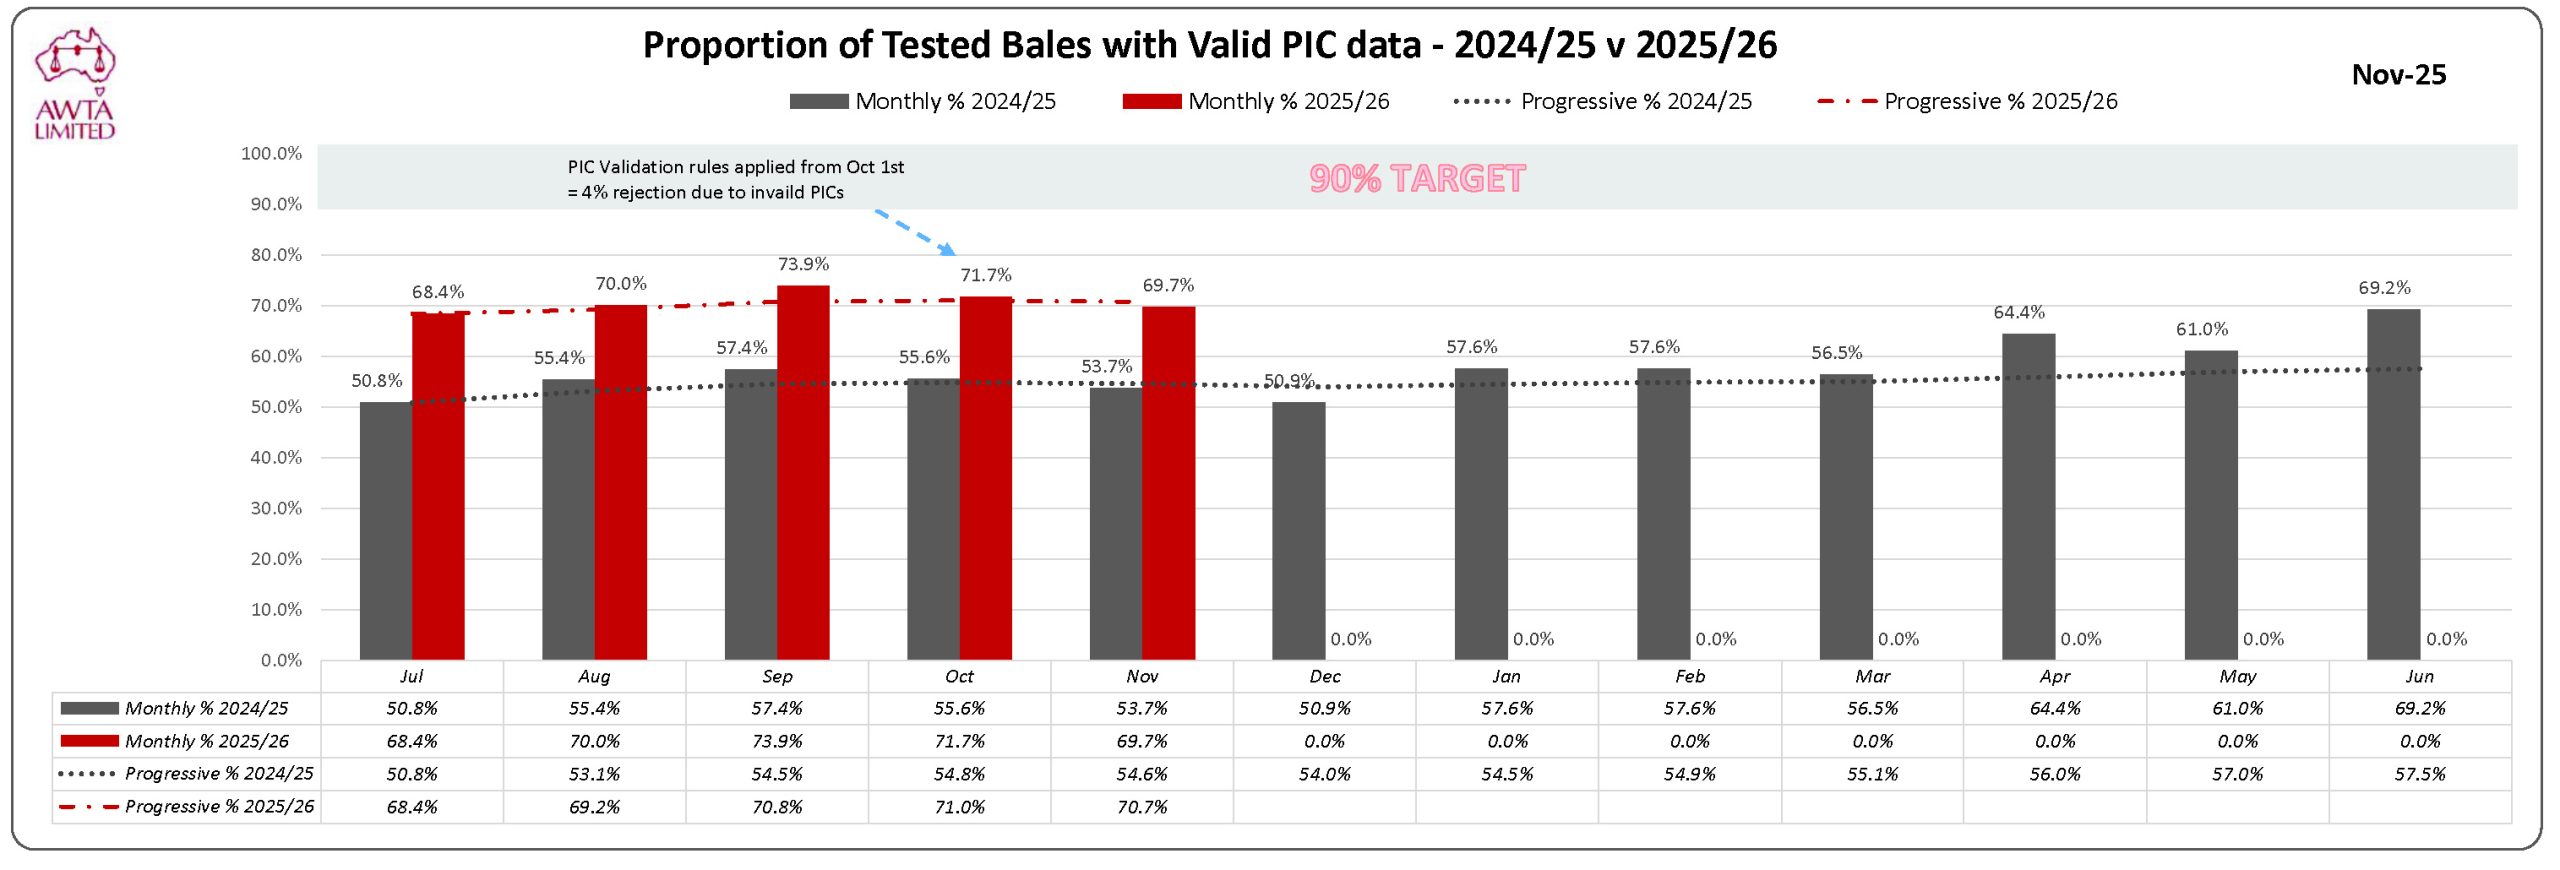
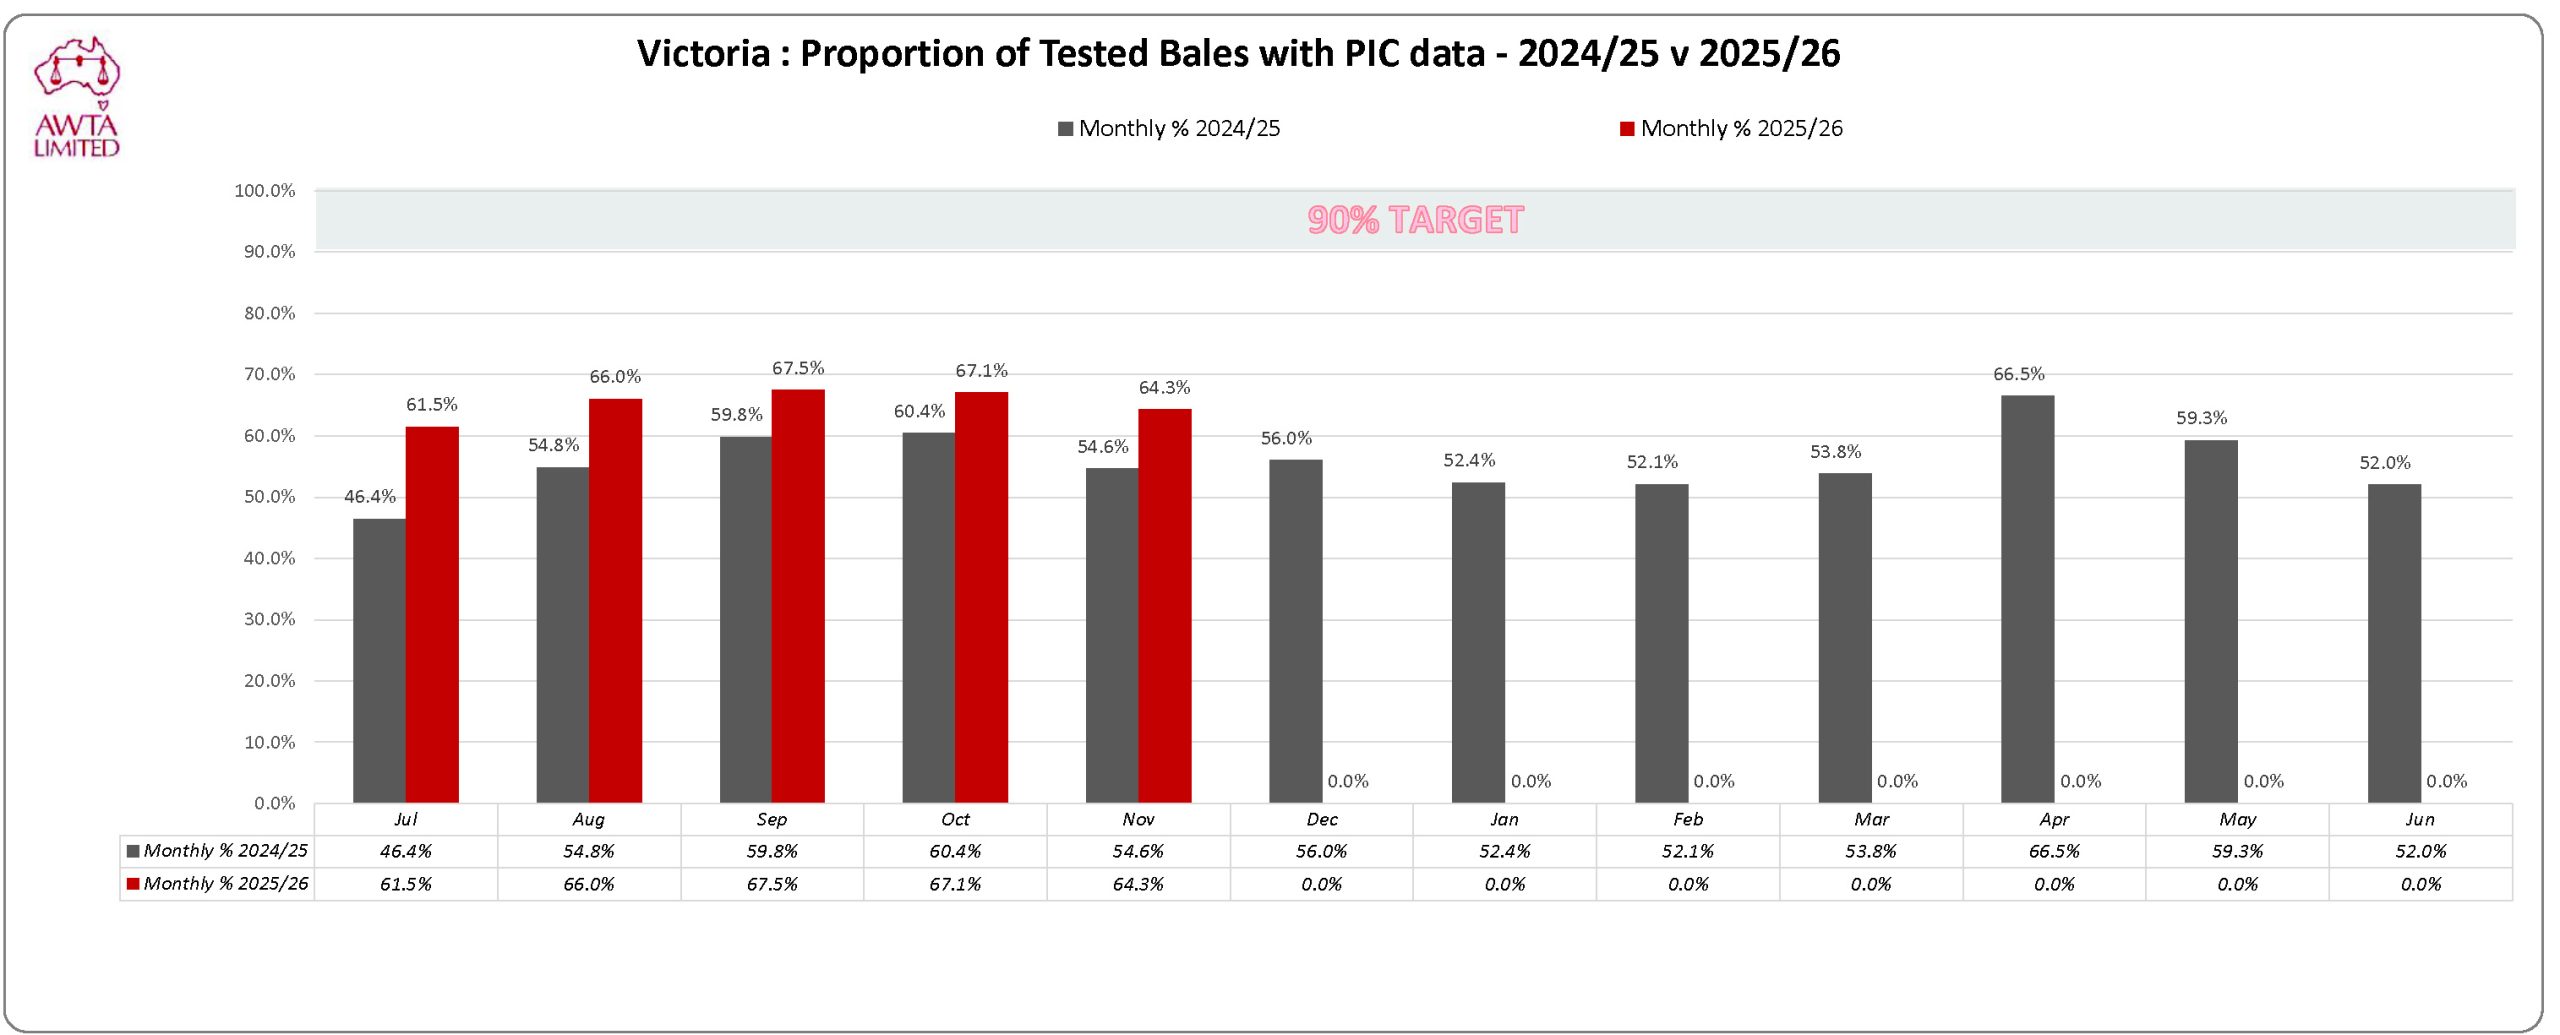
The AWTH provides the digital infrastructure to securely collect, store, and share this data for emergency response and commercial traceability purposes. Monitoring and reporting the rate of PIC transmission is central to these efforts. The latest data is shown below.
Download graphs here: AWTA PIC Graphs
Australian Wool Industry Property Identification Code (PIC) Transmission Analysis
Dark Medullated Fibre Risk (DMFR) Scheme Adoption
The International Wool Textile Organisation (IWTO), through its Australian affiliate, Wool Industries Australia (WIA), advocates to protect the reputation of Australia’s premium Merino white wool by managing the risk of dark and/or medullated fibre (DMF) contamination. The program operates through voluntary declarations made by wool growers on the classers specification that accompanies wool deliveries to selling agents stores and brokers warehouses. This information is forwarded to AWTA who calculate the Dark and Medullated Fibre Risk (DMFR) rating and report in on the Yield & Micron test certificate. The DMFR rating is then displayed in sale catalogues so that buyers can make informed purchases.
More information on the DMFR scheme is available below.
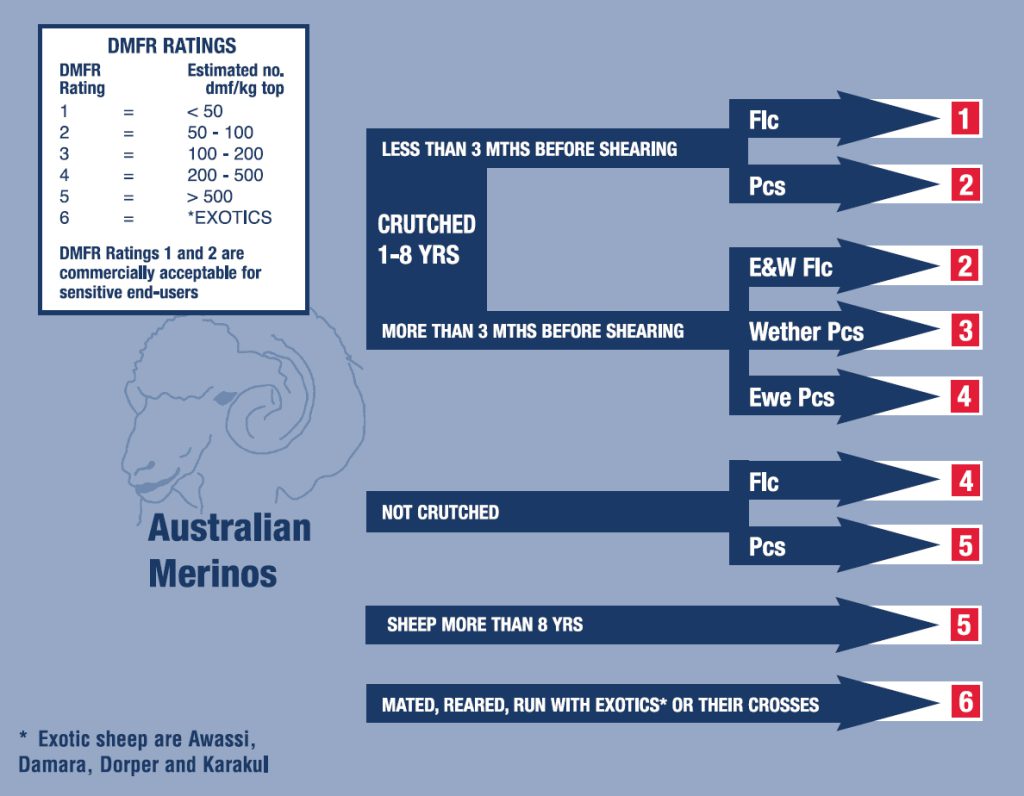
Risk Rating Calculation
The aim of this program is to:
- Enable Australia’s white wool growers to promote their wool as such to buyers
- Provide buyers and processors with a reliable and quantified measure of the level of dark and/or medullated fibre risk in sale lots. This includes contamination of white wool from traditional naturally occurring pigmentation, stains and from the new source, i.e. from contact with exotic breeds
This is achieved by assigning a Dark & Medullated Risk Rating from 1 (best) to 6 (worst) to sale lots, with ratings 1 and 2 suitable for white or pastel shade end products. This is done according to the following diagram.
More information on the DMFR scheme is available below.
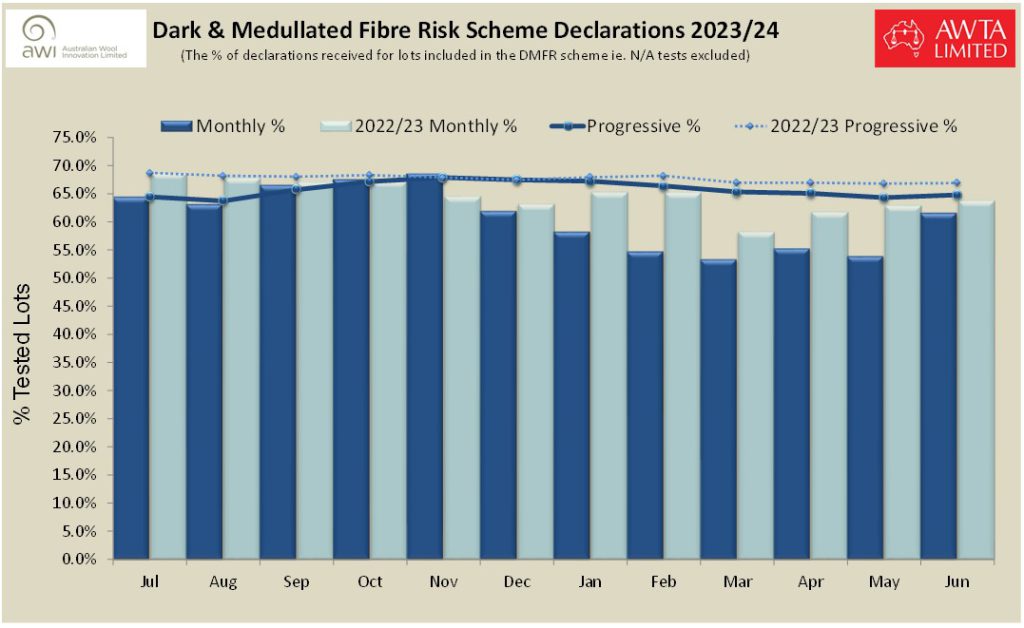
Adoption Rate
The DMFR adoption rate is simply defined as the proportion of tested sale lots that have DMFR data declared by the wool grower. A graph of the DMFR adoption rate, comparing the current and previous season’s data is shown below.
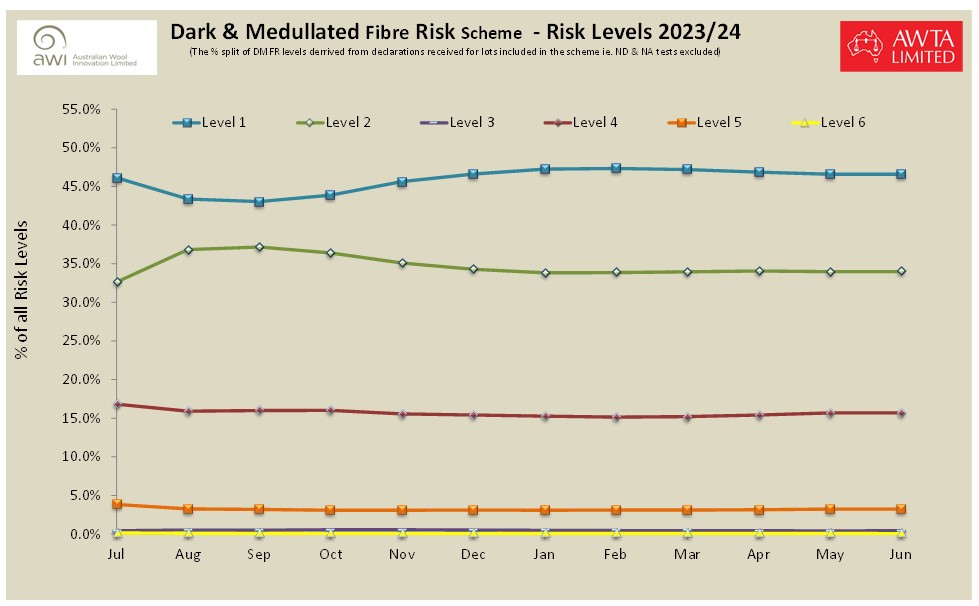
Risk Level Mix
The DMFR Risk Level Mix shows the relative proportion of each risk level in the overall declaration rate. The DMFR Risk Level Mix for the most recent wool selling season is shown below.
Mulesing Status
In July 2008 the Australian wool industry introduced a National Wool Declaration (NWD) scheme. This scheme allows wool growers to declare the Mulesing Status of wool to be tested by AWTA. That category is then displayed on AWTA Test Certificates and in wool auction catalogues.
The Mulesing Status indicates whether wool is produced by mulesed or non-mulesed sheep and, if sheep have been mulesed, whether an analgesic was used to provide pain relief at the time of mulesing. Woolgrowers with sheep that were previously mulesed may also declare that they have since ceased the practice of mulesing.
Mulesing Status Statistics
AWTA Ltd and the Australian Wool Exchange Ltd (AWEX) jointly publish monthly statistics which report the volume of wool both tested and auctioned under the various Mulesing Status categories. These graphs are available on the following link:
https://www.awex.com.au/market-information/mulesing-status/
Further information regarding Mulesing Status Declarations on AWTA Test Certificates is available here: